Twenty-five Percent of Medicare Spending Happens in the Last Year of Life. Here’s What Drives It.
August 11, 2026
A quarter of all Medicare spending happens in a member’s final year of life. That statistic gets cited constantly, and it’s usually read the wrong way.
The takeaway isn’t that end-of-life care is expensive. Care is always expensive. The takeaway is that so much of that spend goes toward care members never actually wanted — ICU stays, terminal admissions, interventions nobody asked for. That mismatch, not the underlying cost of medicine, is what drives the number.
of all Medicare dollars are spent in a member’s last year of life.
It is not simply that end-of-life care is expensive. So much of that spend goes to care members never actually wanted.
That mismatch is what drives the ICU stays, the terminal admissions, and the interventions nobody asked for.
Advance care planning is how you close the gap between what members want and what they get.
Source: Riley GF, Lubitz JD. Long-term trends in Medicare payments in the last year of life. Health Services Research, 2010.
Where the money actually goes
In the last 12 months of life, average medical spending per decedent runs $80,094. Hospital care alone accounts for 44% of that bill — more than physician services, drugs, and long-term care combined. Medicare picks up 66% of the tab.
Physician, drugs & other services — $30,684
Long-term care — $14,034
Medicaid 9%
Private insurance 8%
Uncollected 3%
Other government 2%
Avg per decedent, 2011 (2014 dollars) · Source: French et al., “End-of-Life Medical Spending in Last Twelve Months of Life Is Lower Than Previously Reported,” Health Affairs (2017)
Hospital and facility spend is exactly the piece that earlier hospice enrollment and advance care planning displace most directly. Which raises the obvious question: why isn’t that displacement happening more?
Two numbers explain the whole problem
End-of-life spending comes down to two levers: how often patients get hospitalized, and how appropriately hospice gets used.
Nationally, 69.3% of decedents are admitted to the hospital at least once in their final 90 days. Only 51.3% are served by hospice at death. And among the patients who do enroll in hospice, the median length of stay is just 17 days. Late referrals compress the window where hospice actually saves money and improves the experience.
of decedents are admitted to the hospital at least once in the last 90 days of life
hospice death service ratio — barely half of decedents are served by hospice at death
median days per patient — late referrals compress the window where hospice saves cost
Source: CMS Quality Reporting Programs and Quality Initiatives, 2024–2025 · 51 states + DC
National averages hide the real story, though. State-level data shows the best and worst performers differ by a factor of two or more on every one of these measures.
The state map tells you everything
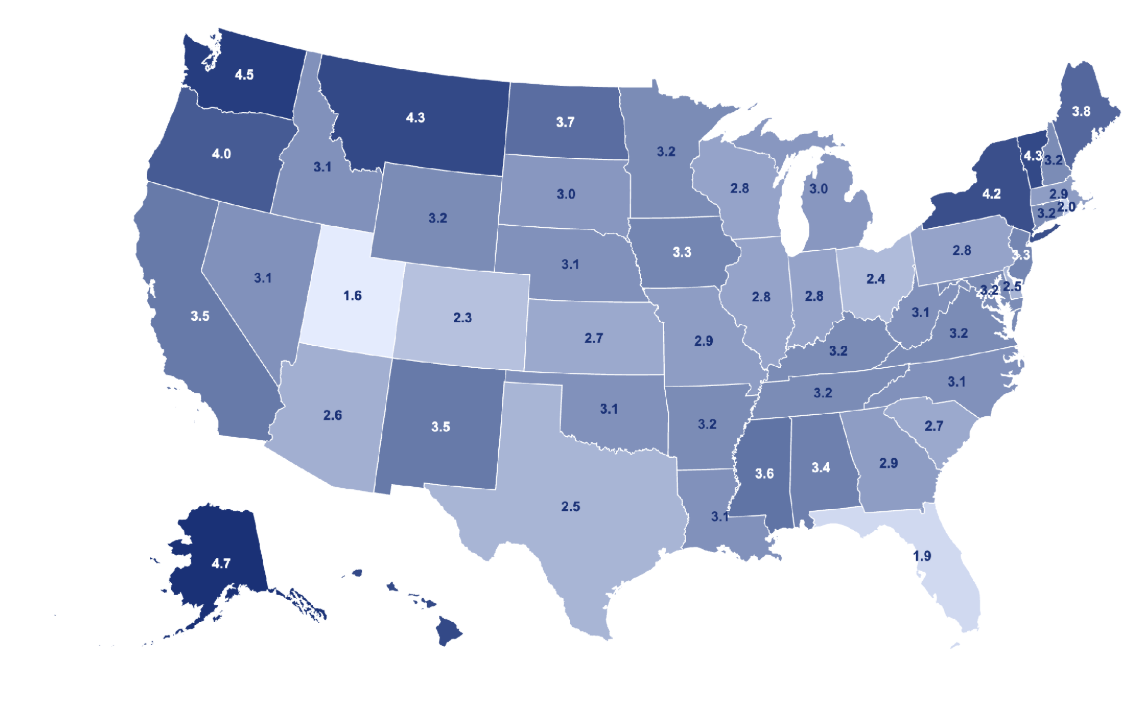
Inpatient mortality — the share of decedents who die as hospital inpatients — ranges from 1.6% in Utah to 4.5–4.7% in Alaska, DC, and Washington state. High-mortality states cluster hard in the Pacific Northwest and mountain West, regions where acute care is substituting for hospice that should be happening instead.
Higher
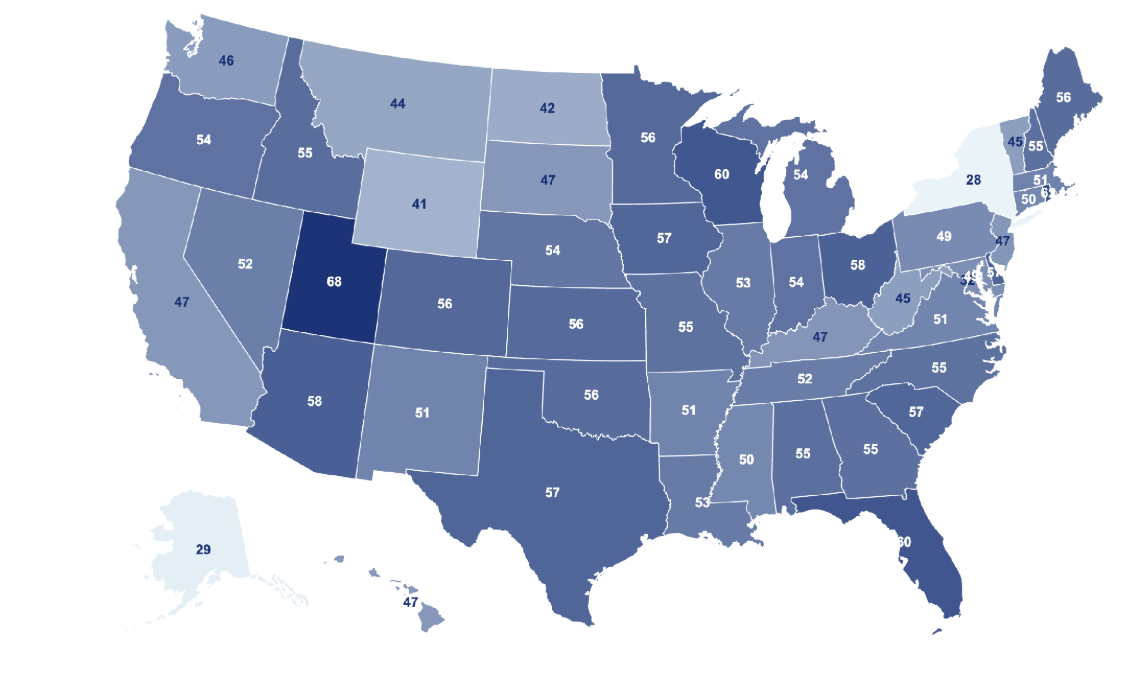
Flip to hospice utilization and you get almost the exact inverse map. Utah leads at 68% — nearly the highest hospice death service ratio in the country — while New York sits at just 27.6% and Alaska at 28.6%. The Sun Belt converts patients into hospice care. The Northeast and Alaska largely don’t.
Higher
correlation between hospice utilization and inpatient mortality across states.
Utah sits in the low-cost corner: high hospice use, lowest inpatient mortality.
New York & Alaska sit opposite — the acute-heavy, hospice-light quadrant.
Each point = one state, 2025 · Source: CMS Quality Reporting Programs and Quality Initiatives
A −0.78 correlation between hospice utilization and inpatient mortality across states. Utah sits in the low-cost corner — high hospice use paired with the lowest inpatient mortality in the country. New York and Alaska sit in the opposite quadrant.
Low hospice utilization is simply the demand-side twin of high inpatient mortality.
Why length of stay matters more than enrollment alone
Enrolling in hospice isn’t enough on its own. Duration is what drives the savings.
Spend per decedent falls steadily as hospice enrollment lengthens. Every stay of 15 or more days lands below the $67,192 no-hospice baseline, and stays of 91–180 days save 14% against that baseline. But the distribution is upside down: roughly 48% of decedents use no hospice at all, and another 26% enroll in just the final two weeks of life. The lowest-cost, longest-stay cohort is the least populated group in the data.

Timing of referral varies enormously by geography too. Average hospice length of stay ranges from 47.7 days in Kentucky to 90.6 days in Alabama — nearly a 2x spread across states. This isn’t a clinical difference. It’s a structural one, driven by when the conversation about goals of care actually happens.
|
Longest stays
|
Shortest stays
|
Average hospice days per patient (ALOS) · Source: CMS Quality Reporting Programs and Quality Initiatives, 2025
Advance care planning is the upstream lever
Here’s the mechanism that ties all of this together. There’s a window, months ahead of a health crisis, when a patient is stable enough to plan and before the next decline. That’s where an advance care planning conversation belongs: a plan made, a surrogate aligned, a document filed.
Plan made, surrogate aligned, document filed — months ahead, while the patient is stable enough to plan.
Avoidable admits and terminal hospitalizations prevented.
Avoidable admits, SNF placement, ED bounce-backs.
The window has closed — wishes go unmet.
Without that conversation, cost events simply stack up downstream — avoidable admits, SNF placement, ED bounce-backs — all of it eventually landing in a crisis nobody chose. With the conversation, the outcome flips: wishes get honored, and costs get contained, because avoidable admits and terminal hospitalizations get prevented before they start. ACP sits upstream of where cost is locked in — and that’s exactly where Koda works.
The evidence backs it up
Published research consistently shows the same pattern:
hospice use vs. 48.3% for controls, nearly 1.6× the rate in the final 30 days
Patel et al., JAMA Oncology, 2018
savings per patient engaged in ACP
Aledade, AJMC, 2022
lower total cost of care, driven by reduced ICU stays in real-world use
WellSpan / Bhatia et al., NEJM Catalyst, 2021
What Koda delivers against that evidence
Koda’s own results track the same direction, at scale. Against matched controls, Koda users show 79% fewer terminal admits and 38% fewer ICU admits. Inpatient length of stay drops 11%, and terminal length of stay drops 30%. Hospice length of stay increases 25%, and hospice utilization increases 51%. Patient and family satisfaction lands at an average NPS of 83.
79% less Terminal Admits
38% less ICU Admits
11% decrease Inpatient LOS
30% decrease Terminal LOS
83 Average Patient NPS
25% increase Hospice LOS
51% increase Hospice Utilization
Cost savings based on a 3rd-party actuarial analysis of Koda users vs. matched controls (n=145)
The bottom line: Koda reduces total cost of care in the last 12 months of life by $11,237 per patient on average — a 19% reduction — based on a third-party actuarial analysis of Koda users versus matched controls.
One model, two entry points
This works whether you sit on the payer side or the provider side, because the upstream lever is the same even if the outreach mechanism differs.
Outreach starts with the member — identified through claims and risk data, engaged directly, with findings shared back to their care team.
STARS / CAHPS impact, retention, TCOC in complex populations
Engagement is built into existing clinical workflow — at diagnosis, admission, or a scheduled visit — with write-back into the same EHR the care team already uses.
shared savings performance, readmission reduction, care team burden
Different entry points, same upstream lever, same outcome: wishes honored, costs contained.